
Technical analysis is popular with many traders for adding to the charts looking for high probability trades. You may be trading stocks and shares, Forex, cryptocurrencies or commodities, but if you are a technical trader, the first thing you may want to do is find the best technical indicators to suit your trading style.
Technical indicators can form part of your trading plan and strategies, but many indicators lag, indicating momentum by tracking prices based on past trends. Indicators can serve as excellent conformation signals to identify trends in the market. Leading indicators can help predict future price movements.
A single indicator cannot measure all the factors necessary for a successful trade, but you can adapt your strategy to use the most valuable indicators. Many traders add several indicators to their charts, marrying them up as confirmation for spotting potential trades.
There are hundreds of technical indicators available. How do you know the best technical indicator to use? Are technical indicators reliable, and how can you adapt them to suit your trading strategies?
Some technical indicators appear complex, and others are simple and easy to use for beginners. With knowledge and experience, you can pick out one or two of the top 5 technical indicators for profitable trading.
This post delves into 5 of the best technical indicators suitable for beginners and intermediate traders.
Contents
- What You Need To Know About Using Technical Indicators
- Can Technical Indicators Explode Your Trading Results?
- Moving Average Indicators
- Relative Strength Indicator (RSI)
- Moving average convergence divergence (MACD)
- Bollinger Bands
- Ichimoku Cloud
- Conclusion: The Top 5 Technical Indicators For Profitable Trading
What You Need To Know About Using Technical Indicators
Technical indicators can be a fantastic addition to your trading plan, helping you to anticipate price momentum. They can help you stay out of the market during volatile or quiet periods and equally identify optimum times for entering the market.
Sadly, many traders misuse technical indicators without understanding the power of knowing the strengths and weaknesses of an indicator.
Novice traders tend to make one of several mistakes:
- Too many indicators on the chart: Some traders' charts look like a highway during rush hour. Novice traders add four or five technical indicators thinking it will help guarantee a win. Having multiple indicators on your chart can be confusing, and you're more likely to misread the market with the conflicting signals from multiple indicators.
- Relying heavily on one technical indicator: You won't find a single technical indicator with a 100% success rate. At times, it may feel like the indicator performs inefficiently. Other times, it presents accurate market signals. Not every technical indicator suits variable market conditions. For instance, your indicator could show false signals if the price consolidates.
- Switching technical indicators after a few losses: Following on from #2, when a technical indicator appears to be letting you down, it's tempting to switch to a new indicator. It's a familiar trait with new traders, but constantly changing indicators becomes confusing and frustrating.
If you're finding that your chosen technical indicator is presenting more false signals than winning signals, reflect on how you are applying the indicator. Professional traders spend years testing indicators to find the best use for assessing high-probability trades. For instance, a technical indicator like the RSI should identify overbought and oversold areas, but many traders find the RSI is better for identifying divergence. It's more reliable than expecting the market to reverse from low or high points on the indicator.
Read Also: Why Do 95% Of Traders Lose Money?

Can Technical Indicators Explode Your Trading Results?
Would you like to explode your trading results?
Can a technical indicator help you to become a more profitable trader? The answer is yes, and no. Don't worry. We'll explain as we expand on each of the top 5 technical indicators for profitable trading.
The thing is, if you haven't laid the foundations of becoming a consistent trader, there are no technical indicators that will get you to the Ferrari showroom. The 5 popular technical indicators in this post are simple to use as part of your trading plan but may take time for you to learn how to use them efficiently
Before considering which technical indicator is best, make sure you have the following list in place:
- Trading plan: Your trading plan must outline what signals you want to see in the market. Plan when to stop trading after consecutive wins or losses. Have a weekly or monthly profit target.
- Strategies: Have a handful of strategies to suit variable market conditions.
- Risk Management: Ideally, risk no more than 1% of your trading capital.
- Financial instruments: If you're trading Forex, become familiar with one or two currency pairs and the same for stocks, shares, commodities and cryptocurrencies. The more you understand the financial instrument you trade, the easier it is to know the best technical indicator to use on the charts.
- Trading Personality: If you are an impatient trader, you may prefer leading to lagging indicators, which can be slow to gather enough data to assess price momentum.
Once you have established the above foundation, you are ready to start experimenting with technical indicators. You may prefer to practice using technical indicators in a demo account first. That way, when you are ready to trade live, you have experience with the indicators and know the best ones to use for your trading.
1. Moving Average Indicators
Moving averages are lagging indicators, but they can make it easy to spot when a trend may change direction if you use a couple of moving averages on your chart for a moving average crossover strategy.
The simple moving average (SMA) and the exponential moving average (EMA) are two different moving averages. Moving averages identify trend direction without being affected by sudden price spikes and help determine support and resistance levels on the charts based on historical price movements.
The Simple Moving Average (SMA)
On the charts, the SMA and EMA may look the same. But if you add a 50 SMA and a 50 EMA, you notice the SMA lags behind the EMA.
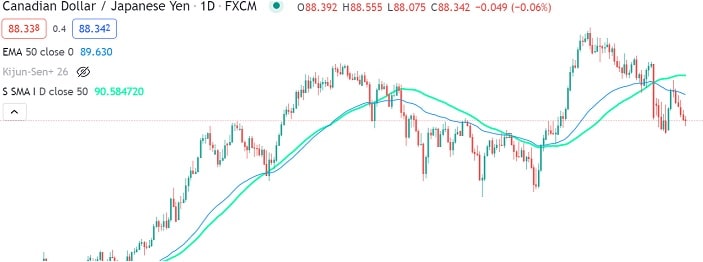
In the image above, the green line is the 50SMA, and the blue line is the 50EMA. Observe that the 50EMA tracks price action a little more closely, making it easier to spot trend momentum.
Remember that moving averages react to the timeframe you're trading. If you're using a moving average of 9 on the 5-minute chart, it will be the average of the previous 9 x 5-minute candles. The daily chart shows the average of 9 x daily candles.
The Exponential Moving Average (EMA)
The EMA is a more dynamic moving average than the SMA.
The EMA is a more accurate form of moving average. Unlike the SMA, it places a greater weight on recent price points, making the data more responsive to new information. For short-term averages, traders may use the 12 and 26 EMAs. The 50 and 200 EMAs are most popular with day traders and swing traders for long-term trends.

The above image is the 50EMA (blue line) and the 200 EMA (green line) showing the power of moving average indicators. The 50EMA crosses over the 200EMA, and the gap widens, indicating the start of a possible new trend. Upward momentum continues as the EMAs separate further apart.
When the EMAs start moving closer together, for experienced traders, it's a sign that consolidation may occur. At that point, it's a good time to exit open trades.
2. Relative Strength Index (RSI)
Relative Strength Index (RSI) is an indicator that shows trend momentum and strength. The principles behind RSI are:
- The price is overbought when it reaches 70 or above
- The price is oversold at 30 or below

The image above is the CAD/JPY daily chart.
The settings for the Relative Strength Index (RSI) are 70/30. The dashed centre line is 50, and the close is 14 (typical settings for RSI)
The RSI indicator is at the bottom of the above chart. Notice the first vertical red line from the left, showing the RSI levels are above 70. Look at the chart and notice the slight price dip. The price then rallied and fell again, which correlates with the chart patterns.
The second vertical line shows that the price is oversold on the RSI (at the level of 30). It bounces off the 50 (middle) line twice before touching the bottom at 30 again and gathering bullish momentum.
The final (red) vertical line shows the price breaking above 70 at a new high. It returns to the top of the RSI line and finally moves down.
It's easy to think the RSI is an excellent indicator to find trades. Consider, though, that you're looking at this price action in hindsight.
The best way to use the RSI is to add it to your charts as a confirmation indicator. Adding the 50EMA and 200EMA on the charts (as above image) enables you to assess false price action. Proving, as with many technical indicators, not to rely on one indicator as a trading signal.
3. Moving Average Convergence Divergence (MACD)
MACD is another stochastic indicator. It works similarly to the RSI but uses two moving averages instead of a single line.

Traders use the MACD to identify convergence (when the two moving averages move closer together) and divergence (when the two moving averages move further apart). When the price is converging, there's less momentum. When the price is diverging, it's gaining momentum.
In the chart above, the MACD shows the two moving averages and, across the centre line, displays green vertical lines above the median for bullish momentum and red vertical lines below the median for bearish momentum.
Again, as with the RSI indicator, you're looking at the MACD in hindsight, and it's not so easy to assess price movement when looking for trades in real-time.
4. Bollinger Bands
Bollinger bands display a price range as it decreases and increases. When the bands are close to each other, there is less price volatility. When the bands are widening, volatility increases.

Most traders use the Bollinger Bands to wait for the price to touch the top or bottom of the band and then break back inside the band.
It's clear to see support levels on the above chart but not so clear on resistance as the price keeps climbing up (the last bullish movement on the chart) without indicating price weakness or a change of direction.
The orange centre line is an SMA that forms part of the Bollinger Band indicator. When the price is above the SMA, it is trending upwards, and when the price is below the SMA, the price is bearish.
Try not to feel overwhelmed by how Bollinger Bands appear on your charts. Follow the simple principles, and you should find it less daunting. You don't have to keep it on your charts during your entire trading session. You can add it at the beginning of your trading session and later for confirming price momentum.
Bollinger Bands can be helpful when combined with other indicators, such as the 50 and 200 EMA.
5. Ichimoku Cloud
Ichimoku means 'one-look equilibrium chart'.
Like most technical indicators, the Ichimoku Cloud measures the support and resistance zones, but it also serves to estimate price momentum and identify market trends.

The Ichimoku Cloud is comprised of 5 lines:
- Tenkan-sen
- Kijun-sen
- Senkou span A
- Senkou span B
- Chikou span
You don't need to understand what each component represents. The idea is when the price is below the cloud, it's bearish. When above the cloud, it's bullish.
The above AUD/USD daily chart shows that price momentum has been bearish for most of the year, only rising above the cloud once and then crashing back below.
The Ichimoku may look complex and messy on the charts, but it's an excellent indicator for assessing trend direction and support and resistance levels.

Conclusion: The Top 5 Technical Indicators For Profitable Trading
Technical indicators are valuable tools for helping traders spot trading opportunities on the charts. We looked at the top 5 technical indicators for profitable trading, and these indicators typically come as standard with MetaTrader 4 (MT4) and MetaTrader 5 (MT5) platforms. Many proprietary trading platforms supply them too.
- Moving Average Indicators
- Relative Strength Indicator (RSI)
- Moving Average Convergence Divergence (MACD)
- Bollinger Bands
- Ichimoku Cloud
It's not advisable to rely on a technical indicator without some other form of confirmation, but you can combine indicators. For instance, add the 50EMA and 200EMA to your charts together with the RSI. You could also briefly add the MACD or the Ichimoku Cloud as a quick way of assessing the trend.
You can add any of the 5 top technical indicators to your trading plan and strategies. With practice, you'll likely discover your preferences for a technical indicator. Most novice traders start with a lot of indicators on their charts. Over time and with experience, gradually start removing technical indicators, choosing to use one or two as needed.
Please note that the above information is not providing advice on tax, investment, or financial services. We provide the above information without considering risk tolerance and a specific investor's financial circumstances.
Trading or investing in financial instruments may not be suitable for all investors. It does involve risk and the possibility of a loss of capital. There are no guarantees for profiting from trading, and it's advisable only to risk what you can comfortably afford to lose.
eToro – Best Trading Platform For Traders And Investors
![]()
eToro have proven themselves trustworthy within the industry over many years – we recommend you try them out.
Your capital is at risk. Other fees may apply
FAQs
Can you use technical indicators for day trading?
Yes, you can use technical indicators for day trading, swing trading or scalping. They work well with most financial instruments.
What technical instruments do professional traders use?
Every professional trader has different preferences, but the EMAs, RSI, and MACD are popular technical indicators for experienced traders. The Bollinger Bands and Ichimoku Cloud are not as popular. With experience, most traders prefer to have less clutter on the charts.
What's the difference between a lagging indicator and a leading indicator?
A lagging indicator, such as RSI and MACD, tracks price momentum. Leading indicators (technically) are slightly ahead of the price action. Some say that Bollinger Bands are a leading indicator.
Do Bollinger Bands use SMA or EMA?
Bollinger Bands use a 20SMA (simple moving average) as standard. If you are on a daily chart, the SMA tracks 20 days. On the hourly chart, the SMA tracks 20 x 1-hour candles.
Which indicator is best for Intraday?
Traders suggest that moving averages, MACD and RSI are best for intraday trading.
Which is better, RSI or MACD?
The MACD performs better in a volatile market. It responds to big swings like the cryptocurrency market, for instance. The RSI is better for tracking tops and bottoms for price reversals on the charts. Even in one trading session, if the market suddenly changes, you could switch from the RSI to MACD or vice versa.
Which moving averages are best for stocks?
The top 5 technical indicators for profitable trading are popular for stock trading. Stock traders most often use the moving averages, especially for long-term trading. The RSI and MACD are also often used for assessing the stock market. Stock traders first identify support and resistance levels and add the appropriate technical indicators according to market conditions.
Read More:
The Top 5 Advanced Forex Trading Strategies
10 Day Trading Strategies for Beginners
How To Identify Your Strengths And Weaknesses As A Trader