
What is technical analysis?
One of the first and most important things forex traders have to learn and master is the two types of market analysis - fundamental analysis and technical analysis. Though the two types of analysis are not mutually exclusive, usually traders will fall into one category or the other. Both fundamental and technical analysis have their unique advantages and disadvantages.
Today, we will be focusing on technical analysis, technical traders and the technical indicators they use to guide their decision. We will also talk about the advantages of technical analysis and why some traders prefer this type of market analysis over fundamental analysis.
Let’s start with explaining what exactly technical analysis is.
The mere term, “technical” tells you a lot about it.
Technical analysis is the process of analysing charts and patterns to predict how prices will change.
Technical trading has been around for a long time and it’s based on the idea that history (or in our case the market) tends to repeat itself.
Therefore when certain patterns and indicators become apparent, the prices are highly likely to move in a specific direction.
Essentially, a technical trader relies on the provided framework to make well-informed decisions when to enter or exit a trade. The framework helps technical traders study the current price action and compare it to previous historical occurrences.
Technical analysis studies past price movements, making it more of a highly challenging “art,” rather than science. When we are trying to predict future price movements with technical analysis there can be slight differences, sometimes leading to different conclusions.
To help you decide when to open or close your trades, technical analysis relies on mathematical and statistical indexes. If you are a technical trader, you can use chart patterns (bar and line charts), indicators and oscillators, derived from moving averages and trading volume. The most popular charts for technical analysis is the candlestick chart.
The main tool for technical analysis and the most important thing you have to take into consideration is price data, regardless of the chosen timeframe.
Speaking of time frames, technical indicators can analyse time frames ranging from one minute to up to a year.
Technical analysis can be applied in various other markets, including futures, individual stocks, commodities and more. If the market has a good amount of liquidity and is not easily affected by outside influences, technical analysis can be applied and achieve effective results.
What are the benefits of using technical analysis?
Let’s start by saying that technical analysis does not include any type of “magic,” like many fundamentalists may say. Some of the advantages include:
- Technical analysis can be done quite quickly, just by assessing the direction and the strength of trends;
- Technical analysis can be applied to any trading instrument and in any desired timeframe (long, medium, short - from minutes to years);
- It is used not just in analysing currencies in the forex market but in the stock, commodities and interest rates markets;
- It can be used as a standalone method of market analysis or it can also be combined with fundamental analysis or any other market timing techniques;
- With the use of popular technical indicators (and chart patterns), traders can apply tools that are already available and find potential trading opportunities;
- Technical analysis allows us to see a mass of structured information placed into our screen, giving traders a sense of control;
Technical vs. Fundamental Analysis

As previously mentioned, there are two types of market analysis - fundamental and technical. Though this time we are specifically focusing on technical analysis, it’s also beneficial to mention what are the differences between the two main analyses.
Many traders debate about which type of analysis is better. Let’s find out what are the differences.
While technical analysis forecasts price movements using chart patterns, fundamental analysis takes into consideration various economic data, such as GDP, interest rates, inflation, unemployment rates, etc.
Technical analysts consider price action (charts) in short, medium and long time frames, while fundamental analysts take into consideration economic factors, news and events happening in the medium or short term.
The skills required for the two types of analyses also differ a little bit. If you are a fundamental analyst you have to be able to read through and understand economics and statistical analysis; if you are a technical analyst, you have to be able to work with various charts and indicators.
To sum it up, fundamental analysis basically involves assessing the economic well-being of a country which affects its currency; it does not take into consideration currency price movements like technical analysis. Data points are used in fundamental analysis to determine the strength of a currency.
Technical Indicators
Stochastic Indicator
.jpg)
The Stochastic Indicator was developed by George Lane. It is a highly useful technical indicator that basically helps traders determine where a trend end. It uses a scale to measure the extent of change between the prices of one closing period in order to predict how long the current direction of the trend will continue.
The Stochastic Indicator follows the theory that: 1) when there’s an uptrend, prices will remain either equal to or above the previous period closing price; 2) when there’s a downtrend, prices will remain either equal to or below the previous closing price.
It’s also important to note that Stochastic is a momentum oscillator. It consists of two lines - %K - fast line, and %D - slow line. It operates on a scale between 1 and 100.
Bollinger bands

Bollinger bands were invented by financial analyst John Bollinger and are one of the best and most useful indicators to have on your charts. Bollinger bands measures volatility as a method of identifying a trend.
The basic idea of the Bollinger bands is that prices will bounce back, just like an elastic band. It uses two parameters: 1) The number of days for the moving average and 2) How many deviations you want the band to be placed away from the moving average.
Bollinger bands show the highest and lowest points the price of an instrument reaches. If the bands are far away from the current price, that shows that the market is very volatile and it means the opposite if they are close to the current price. It’s advisable to use them in uptrends, downtrends and ranging markets. If you are a beginner, you should gain some solid experience first before using them.
See Also: Forex Trading For Beginners: Everything You Must Know To Succeed Made Simple
Ichimoku Cloud

The Ichimoku cloud indicator, also referred to as Ichimoku Kinko Hyo or Kumo Cloud, isolates high probability trades in the forex market.
This indicator is relatively new to traders, however, its popularity has been rising in the past few years, especially among novice traders.
The Ichimoku cloud shows more data points and thus provides a more predictable analysis of price action.
Ichimoku Kinko Hyo combines lines, plotted on a chart measuring future price momentum. It also determines areas of future support and resistance. To many, it seems like a complex indicator probably due to the different lines and their special meaning. Let’s quickly check them out!
Kijun Sen (blue line): This is the baseline. It’s the average of the highest high and the lowest low for the past 26 periods.
Tenkan Sen (red line): This is the turning line. It’s the average of the highest high and the lowest low for the past 9 periods.
Chikou Span (green line): It’s also called the lagging line. It showcases today’s closing price, calculated 26 periods behind.
Senkou Span (red/green band): The first Senkou line averages the Tenkan Sen and the Kijun Sen, plotted 26 periods ahead, while the second Senkou line averages the highest high and the lowest low over the past 52 periods, plotted 26 periods ahead.
Moving Average Convergence Divergence (MACD) Indicator

This technical indicator was created by Gerald Appel in the late 1970s. It is used to identify moving averages that point out a new trend, regardless of whether it’s bullish or bearish. It is a top priority for traders to be able to identify a trend because that’s how they can make money.
MACD basically shows the relationship between two moving averages of an asset’s price.
With the MACD chart, traders can see three different numbers, used for setting up the tool - 1) periods used to calculate the faster-moving average; 2) periods used in the slower moving average; 3) the number of bars, used to calculate the MA of the difference between the slower and faster moving averages.
The MACD is certainly a versatile tool. To find out more about it, go here.
Commodity Channel Index (CCI) Indicator
.jpg)
The CCI indicator measures the difference between the current price of an asset and its historical average price.
If the CCI is above zero, this means that the price is above the historic average whereas when the CCI is below zero, this means that it’s below the historic average.
Ratings of, let’s say, 100 or above indicate that the price is above the historic average, meaning that the trend has been keeping strong positions and is on the upside. The opposite, low readings below -100, for instance, state that the price is way below the historic average and thus the trend has been going strong and is on the downside.
Such information about price trend direction and strength helps traders decide if they want to enter or exit a trade, avoid taking a trade or add to a position. In a certain way, this indicator can act like a trade signals provider.
Relative Strength Index (RSI)

The Relative Strength Index (RSI) is a momentum indicator, composed of a single line scaled from 0 to 100 that identifies overbought and oversold conditions in the forex market.
If the rating is over 70, that indicates an overbought market whereas readings that are below 30 indicate an oversold market.
Basically, the idea of RSI is to spot the tops and bottoms in order to get into the market as a trend is reversing. This will bring you an advantage to the whole move. When the price of a certain instrument reaches the overbought levels (over 70), a trend will reverse and the prices will start declining. When prices reach underbought levels (below 30), the price will start increasing.
RSI also showcases when a trend is about to end.
Don’t rely solely on RSI. Regularly check the economic calendar for big news that might affect the price of the instrument you are interested in.
Fibonacci Retracement

Fibonacci retracement levels are a predictive technical indicator, based on the key numbers, identified by Leonardo Fibonacci back in the 13th century. The Fibonacci retracement levels try to identify where the price of an asset may go in the future.
The idea is that once there’s a trend movement to a new direction, retracements will use horizontal lines in order to showcase the areas of support/resistance at the key Fibonacci indicator levels before the price continues in the original direction of its trend.
By drawing a trendline between two extreme points and then dividing the vertical distance by key Fibonacci ratios (which are 23.6%, 38.2%, 50%, 61.8% and 100%), you will generate these levels.
Many forex traders pay close attention to these levels and are placing buy/sell orders to take profits. To apply the Fibonacci levels to your charts, you have to identify Swing High (a candlestick with two lower highs minimum on the left and right of itself) and Swing Low (a candlestick with two higher lows the left and right of itself) points first.
The Fibonacci retracements have proven to be useful in creating an effective Fibonacci forex trading strategy.
You can learn more about Fibonacci forex trading strategies here.
Average true range

Essentially, the Average true range (abbreviated to ATR) is a volatility indicator that displays how much, on average, an asset moves over a certain period of time.
It was developed initially for the commodities market by J. Welles Wilder to measure the volatility of price changes, however, is now widely used by forex traders, as volatility is highly prevalent in the forex market.
The ATR indicator moves up/down as price movements in an asset become larger or smaller. The ATR indicator is usually derived from the 14-day moving average of a series of true range indicators.
The indicator has many uses for day traders and can be used as a trailing stop loss.
An important thing to remember is that the ATR indicator won’t tell you the direction of the trend. It can, however, assist you in your trading strategy by following the rule that high volatility usually follows low volatility and vice versa.
You can use this knowledge to discover breakout trades before they occur. For instance, when a market instrument reaches low volatility, it means that if a trend breaks, a big break out may follow right up.
If this happens, it is a good sign for traders to buy as the price will most likely increase.
MFI (Money Flow Index)

The MFI is a technical oscillator that basically uses price and volume in order to identify overbought and oversold conditions of an asset.
Traders use it to spot divergences, which will warn them of a trend change in price.
The MFI moves between 0 and 100.
In comparison to other oscillators, such as RSI (Relative Strength Index). The MFI incorporates both price and volume data, instead of just price. That’s why many technical financial analysts call MFI, the volume-weighted RSI.
The indicator is usually calculated using 14 periods of data. An MFI reading above 80 is overbought and an MFI reading below 20 is oversold.
Average Directional Index (ADX)
.jpg)
The Average Directional Index (ADX) is another example of a technical oscillator.
ADX is usually used to identify if the market is ranging or starting a new trend.
What it does best is help traders decide whether it’s okay to jump in an ongoing trend or not.
ADX fluctuates from 0 to 100. Readings below 20 indicate a weak trend and readings above 50 indicate a strong trend.
In comparison to the previously explained stochastic oscillator, ADX cannot determine if a trend is bullish or bearish. It measures the strength of the current trend.
Traders use ADX as a confirmation whether the currency pair could continue its current trend or not. Many traders combine ADX with another indicator, in most cases one that can identify downtrends or uptrends.
Parabolic Stop and Reverse (SAR)
.jpg)
Parabolic Stop and Reverse (SAR) is probably one of the simplest and best technical indicators to use in Forex.
The Parabolic SAR is a trend indicator, developed by J. Wells Wilder and it is used to determine trend direction and reversals in price.
It’s quite basic and simple to understand. The parabolic SAR indicator appears as a series of dots, displayed on the chart above/below the price, indicating the (potential) direction of the price will move in.
If the dots are above the price, this means the market is in a downtrend. This indicates to traders that you should go short. On the other hand, if the dots are below the price, the market is in an uptrend, meaning you should go long.
Traders are advised against using the Parabolic SAR in a ranging market if the price is moving sideways as there will be a lot of noise, preventing from getting a clear signal from the dots.
Simple Moving Average (SMA)
.jpg)
When it comes to core indicators in technical analysis, moving averages are right there at the top. There are a variety of different versions but the simple moving average (SMA) is probably the easiest moving average to understand and construct.
The SMA (simple moving average) is the average price of an asset (such as currency pairs), over a specific time period. The longer the period of the SMA, the better and smoother the result. This is basically what SMAs are commonly used for, to polish price data and other technical indicators.
It’s called a “moving” average because it forms a line that moves along the chart when the average value changes.
SMA is usually used by traders to determine trend direction. If the SMA is going up, that means the trend is up too; if however, the SMA is moving down, the trend is also going down.
Exponential Moving Average

The Exponential Moving Average (EMA) differs from the above-mentioned simple moving average (SMA) in two ways: 1) the EMA puts more weight and significance to the most recent data points and 2) the EMA reacts way faster to price changes that happened recently, than the SMA.
The EMA is one of the most popular forex technical indicators and it’s often chosen by traders as the basis of their trading strategy. This technical indicator is used to produce buy/sell signals, based on the position of the short-term EMA, in relation to the long-term EMA.
A trader usually enters buy orders if the short-term EMA crosses above the long-term EMA.
Traders most commonly use 5, 10, 12, 20, 26, 50, 100, and 200 EMAs. For those who operate with shorter timeframe charts (such as 5-15 minute charts), 5 and 10 EMAs are usually used. Traders who look at higher timeframes operate with higher EMAs, such as the 20 and 50.
Ultimately, the EMA works best if there’s a strong current trend present over a long period of time.
On-balance volume
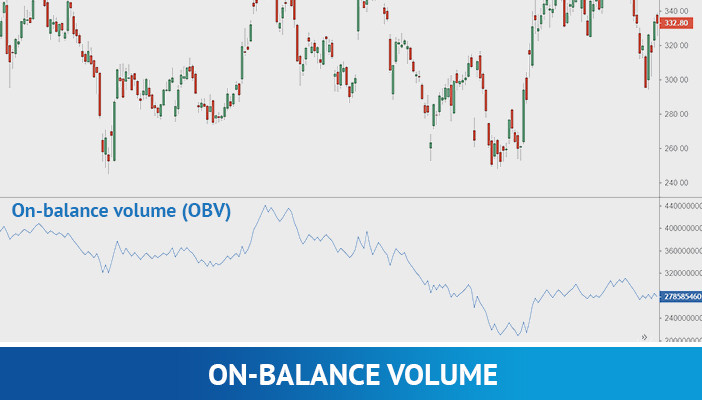
On-balance volume was coined by Joe Granville back in 1963. On-balance volume, abbreviated to OBV is a technical indicator that basically measures the positive/negative volume flow and how volume is connected to price change.
The OBV indicator follows the idea that volume precedes price. According to this concept, when the price is going up, it attracts greater volume. The volume will also go down when the price is going down.
This indicator helps traders find out whether a particular currency is accumulated by buyers or sold by sellers. It indicates the flow of the money - is it in or out of the currency? Not just that but traders also use this tool to forecast future trends.
OBV should be used in combination with other indicators, it cannot be solely relied upon.
You can check out more information on the On-balance volume Indicator here.
Pivot Points

A Pivot Points is yet another technical analysis indicator that is used to determine price movements (the overall trend of the market) over different time periods. Pivot points are also one of the most widely used technical indicators in day trading.
To put it simply, a pivot point basically is the average of the high, low and closing prices from the previous trading day or trading session.
A pivot point is a price level, used by professional traders to determine if the prices are bullish or bearish. Trading above the pivot point indicates bullish sentiment; on the other hand, trading below pivot points indicates bearish sentiment.
The basis for the indicator is the pivot point; however, it can also include other support/resistance levels, estimated based on the pivot point calculation. These levels help traders to know in which direction is the price trending.
Dynamic Momentum Index
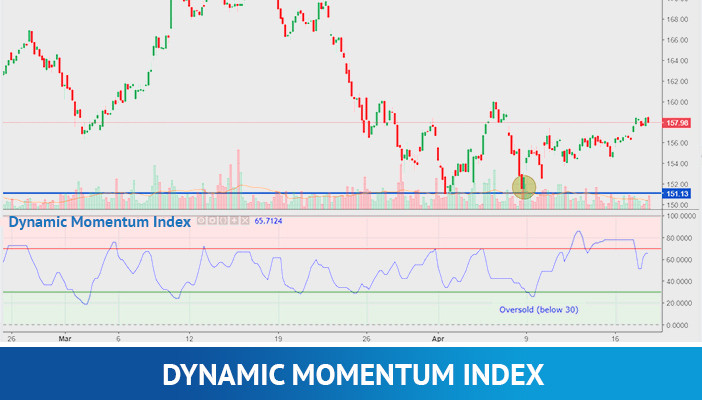
The next technical indicator we will introduce is called the dynamic momentum index and it was developed by Tushar Chande and Stanley Kroll.
DMI is quite similar to the previously-explained RSI (relative strength index) in the sense that it determines if an asset is overbought or oversold. The main difference is that the RSI uses a specific number of time periods in its calculation whereas the DMI uses different time periods, taking into consideration the changes in volatility. The fixed number of time periods is usually between 5 and 30. When volatility is high, the dynamic momentum index uses fewer periods and when volatility is low, it uses more periods.
Moreover, this indicator is also used by traders to generate trade signals in the direction of the trend (when the market is trending) and also provide buy/sell signals (when it’s a ranging market).
If the indicator shows below 30, it means that the price of the asset is oversold. If it’s above 70, that means the price is overbought.
In addition, the DMI is used to interpret buy/sell signals. If the price moves out of the oversold territory, that is a buy signal; if the price moves out of the overbought territory, that can be used a short sell signal.
Directional Movement Index

The Directional Movement Index (DMI) is an indicator developed by J. Welles Wilder in the late ‘70s. It helps traders identify in which direction the price of an asset is moving.
The indicator is able to do this by comparing prior highs and lows and drawing two different lines:
1) A positive directional movement line (+DI)
2) A negative directional movement line (-DI)
If the +DI line is above the -DI that means that the upward movement is stronger than the downward movement. If the -DI line is above the +DI line it means the opposite - there’s a stronger downward movement than upward movement.
The lines can also signal emerging trends. For instance, if the +DI line crosses above the -DI line, it can be interpreted as the start of an uptrend in price.
Some traders add the Average Directional Movement Index (ADX) to the DMI indicator.
Aroon Indicator

The Aroon indicator is a technical indicator that helps traders know when the market is in an uptrend or a downtrend or it’s in a range-bound, trendless market. It was designed by Tushar Chande and it assists traders worldwide to identify upcoming trends before they happen.
By using two components, “Aroon up” and “Aroon down”, the indicator is designed to show traders when a new trend begins, what its magnitude and the changes from range-bound behaviour and trending patterns.
“Aroon up” calculates how long it took the price to reach its latest high. “Aroon down”, on the other hand, calculates the time it’s taken since the price reached its latest low.
The Aroon indicator is utilised by many traders as part of their trend-following strategies.
Klinger Oscillator

The Klinger volume oscillator was developed by Stephen Klinger and it is used to predict price reversals in a market by comparing volume to price. (Volume measures the number of units of a certain security or index traded per unit of time.) Simply put, according to this indicator, trend and volume are the predominant influences in trading.
For many traders, the divergence between volume and price can be instrumental. For instance, if an asset has a high volume and the price is trending sideways (or downwards), this would mean that any ongoing trend will soon be reversed. If the price is going up and the volume is falling, this could indicate weak buying strength.
It is also considered as one of the more complex oscillators because it uses a formula averaged over a shorter EMA (Exponential moving average) and a longer EMA.
Percentage Price Oscillator

The Percentage Price Oscillator (PPO) is a technical momentum indicator that basically displays the relationship between two moving averages in percentage terms. The moving averages are usually a 20-period or a 12-period EMA.
Traders use the PPO to compare volatility and asset performance and spot divergence, which could all help spot trend direction, generate trade signals and lead to price reversals.
The PPO is somewhat identical to the MACD (moving average convergence divergence) indicator, however, the PPO measures the difference in percentage between to EMAs. MACD, on the other hand, measures the absolute difference.
Most traders prefer the PPO because its findings are comparable between assets (such as currency pairs) with different prices.
Final Thoughts:
Throughout this article, we’ve discussed many types of forex trading indicators that are widely used by professionals. By using technical indicators, traders are easily notified when there are favourable conditions and thus can make better, more reasonable and well-calculated decisions.
Ultimately, markets are not completely random. Many traders and investors use technical analysis indicators to help them spot patterns and achieve good results.
Technical analysis indicators also assist traders in assessing the direction and strength of trends.
Traders don’t necessarily rely on one indicator only. Most of the time, they combine a primary indicator with two or more to achieve better confirmation and end up on the winning end.
Keep in mind that each one of the indicators we talked about has its own unique benefits and technical traders are actively using them.
If you are interested in becoming a technical trader and learning more about the advantages of technical analysis, you can sign up for our free trading course, “The Ultimate Guide to Forex Trading”.
Our course can teach novice traders about technical analysis and help lay solid foundations for beginners who in the future want to develop as technical traders.
Signing up for the course is easy!
All you have to do is open an account with one of our partner brokers who are sponsoring our free forex trading course. Once you place a deposit and send us your account number, the course will be yours for free!
It’s your best chance of learning about technical analysis and technical indicators!
Where can you learn more about technical analysis and technical indicators?
We hope that this article gave you a little motivation boost by showcasing the many different ways in which you can spread your trader wings. As you’ve noticed there are many indicators that can help you make the right decision and become an efficient and profitable trader.
We, at Trading Education, are offering a complete forex trading course, “The Ultimate Guide to Forex Trading” for free.
By taking our course, you will learn about:
- Foundation In Forex Trading
- Mechanics Of Forex Trading
- Advanced Analysis in Forex
- Strategy In Forex
We are giving it away for free thanks to our partner brokers who want to make sure there are more well-educated traders out there who don’t give up on forex right after their first loss.
Apply for your free forex trading course and conquer the complicated yet highly rewarding world of forex with Trading Education!
eToro – Best Social Trading Platform
![]()
![]()
67% of retail investor accounts lose money when trading CFDs with this provider