
Trend following trading strategies are often the most successful trading strategies to use.
As a beginner, they are the best strategies to follow because they are often easy to implement. By using them you can also learn how the market works and make a profit as well.
Many traders, beginners and professionals alike, rely on trends. Some even say that you can make a living off just one pattern, that is if you know how to use it.
This doesn’t mean though that trend trading is always easy though.
You may have heard the phrase ‘the trend is your friend’.
However, there is another phrase which is also true; “The trend is your friend until the end when it bends.” Wise words from professional trader Ed Seykota.
Before we get started, let’s look at what a trend following trading strategy should have.
What should trend following trading strategies have?
There are a number of things a trend trading strategies should have. Here a few key things to look for:
- They should be able to clearly identify an emerging trend. Spotting a trend is one of the first things your trading strategy should be able to do.
- Find entry and exit points. Every trend trading strategy needs to have an entry and an exit point already in mind! If you don’t have these, you cannot call it a strategy!
- Spot when a trend is changing. This can be an important moment to change your strategy and implement another.
- Be well-informed by technical and/or fundamental analysis. Analysis can help you spot when such trends may take place.
- Be easy to implement, learn and repeat. The more steps and variables there are in your strategy, the more things can go wrong.
A few other things to bear in mind:
- Always wait for confirmation of a trend before you act. Trend trading isn’t just buying when the market is down or selling when it’s up. It’s buying when the market is down, but on the verge of going up and selling when the market is on the verge of going down.
- Don’t just have a strategy for uptrends. Have a strategy you can use in a downtrend and ranging market as well.
- Use a trading journal to keep track of all your trades. This way you can learn which strategies are effective, which are not and which ones need a little tweaking.
- Take into consideration risk management. You should know your risk-reward ratio well before implementing a trading strategy.
- Always use stop-losses. Make them a part of any trend trading strategy you use.
Want to learn how to implement trend following strategies? Then take our free forex trading course!
Top 10 trend following trading strategies
Let’s get stuck in!
1. Bollinger bands

Bollinger bands were invented by John Bollinger. They are a highly useful indicator to have on your charts.
Bollinger bands assume that prices will bounce back, like an elastic band.
Essentially what they do is show the highest and lowest points the price of an instrument reaches. They can be used in uptrends, downtrends and even in ranging markets.
The most useful thing Bollinger Bands do is measure volatility.
If the bands are very far away from the current price, it can indicate that the market is very volatile. If they are very close to the current price, it means the opposite.
Many traders, particularly beginners, should be advised to keep away from either of those two.
You can use Bollinger bands as part of your trend trading strategy by buying when the price reaches the lower band and selling when the price hits the upper band.
You can read more about Bollinger bands here.
2. Moving averages

Moving averages are an excellent way to see the underlying trend behind an instrument and can be viewed on most charts.
There are many different moving averages, though many trend traders choose to use a slow moving average.
They are a great way to focus on the real price and direction of a trend and can help traders avoid mistaking temporary changes in price for trends.
You can use moving averages in your trend trading strategy by buying when the current price dips below the moving average and then selling when the current price meets the moving average or peaks above it.
An important thing to remember about moving averages is that they cannot highlight if a trend will end or not. They can only show you past movements. So you cannot solely rely on them.
3. Bull and bear flags

Bull and bear flags are opposites of one another.
They can be made when you apply a channel pattern over them (more on channel patterns below).
The lower part of the movement represents the flag pole and the channel lines represent the flag itself.
When they appear, they symbolise that a trend was momentarily interrupted.
In a bull flag, the market is on the rise. In a bear flag, the market is on the decline.
You can incorporate bull and bear flags to your trend trading strategy by entering the market and getting and riding a trend.
4. Triangle patterns

Many different types of triangle patterns and some people refer to them as wedge patterns.
Typically, what happens with a triangle pattern is the price gets narrower and narrower and then eventually breaks out into an uptrend or a downtrend.
Here are a few common triangle patterns you can look into:
- Symmetrical. As you can guess, this pattern is characterised by its symmetrical shape. It can break out into an uptrend or a downtrend. This is only confirmed when the price breaks its narrowing cycle.
- Ascending. Ascending triangles form in a bull market. When they break out, they will typically rise.
- Descending.
To make use of triangles in your trend trading strategy, you need to buy or sell once you’ve reached the length of the triangle.
For example, if the length of the triangle is 50 pips, aim to buy or sell when the price reaches 50 pips after breaking.
5. Relative strength index

Relative strength index or RSI, is an oscillator indicator and has been around since the 1970s and is very popular.
It is used to work out if an instrument is overbought or underbought.
Anything over 70% is said to be overbought, anything lower than 30% is said to be underbought.
Typically, what will happen is when the price of an instrument reaches overbought levels, a trend will reverse and prices will start to decline.
The opposite is true when the price reaches underbought levels; it will start to increase in price.
To use this indicator properly, it is best to stick to daily or larger charts otherwise you may receive too many signals to buy or sell.
RSI can also show if a trend is about to end too.
When a downtrend is about to emerge, this can be seen when RSI dips while price doesn’t. This can act as a signal to sell before the downtrend starts.
Like all indicators and patterns in trading, you cannot solely rely upon it. This is especially true if big news breaks out and the price of the instrument takes a dive down or soars up.
6. Head and shoulders

The head and shoulders pattern is very common and symbolises that a trend has come to an end and a new one has emerged. They also work upside down as well.
They are called head and shoulders because the shape they make looks like a persons head and shoulders (as you could probably guess!).
The shoulders represent either two high or two low points with the head being the highest or lowest price the instrument reached.
In the upright position, when this pattern emerges, it means an uptrend has come to an end and a downtrend will now begin. If you have a position open, now is the time to close it.
When upside down, a downtrend has finished and an uptrend has emerged. This is a perfect opportunity to buy.
7. Channel patterns
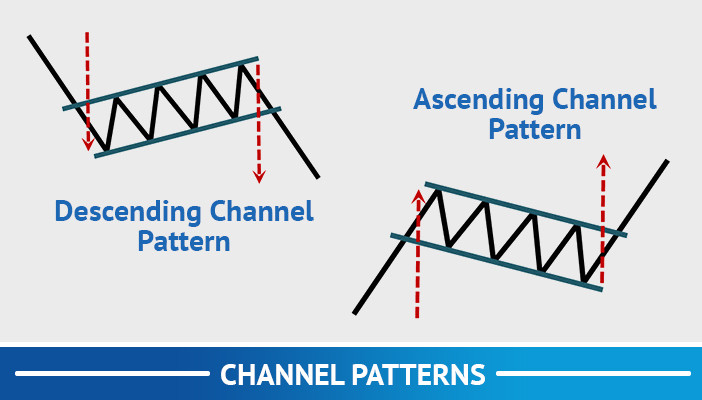
Channel patterns are highly useful and can be used in uptrends, downtrends and in ranging markets.
They are made with the channel pattern tool on your charting software and used to pinpoint highs and lows in market price.
You can use them in your trend trading strategy by selling when they reach higher points and buying when they reach the lower points while a trend is in motion. Much in the same way as Bollinger bands, mentioned above.
Be warned though, it can be hard to spot when a trend ends. When this happens, you need to redraw your channel pattern. Make sure you look out for break out moments to avoid this happening.
They can also be difficult to apply in highly volatile markets.
8. Average true range

The average true range, often abbreviated to ATR, is an indicator that measures volatility in market price.
Essentially, the larger the candles, the larger the ATR.
Keep in mind though that the ATR indicator does not tell you the direction of the trend.
If the price starts getting closer or even ranging, the ATR goes down. If a bear or bull market emerges, ATR rises. It does not distinguish between a bull or bear market.
You can use ATR in your strategy by following this basic rule; high volatility usually follows low volatility and vice versa.
With that in mind, if a market instrument reaches historically low volatility, it could mean that if that trend breaks, a big break out may follow.
If that happens and the price is going up, it can be a sign to buy as it means the price will likely increase.
9. Double tops and double bottoms

Another example of a trend strategy that works both ways and symbolises a trend has ended and a new one has begun.
If a double top appears, it means an uptrend has come to an end and downtrend has started. It is characterised by two peaks in price. Typically, the second peak will be smaller.
When a double top has taken place, it is a sign that you should sell as the price will only get lower.
The reverse is true of double bottoms. They are characterised by two dips in price with the second one typically being a little higher than the first.
When double bottoms take place, you should see it as a sign to buy as the price will likely get higher.
Another thing worth mentioning is that there is also a phenomenon called triple tops and triple bottoms too. They are the same as what we have mentioned above, but with three tops or three bottoms instead.
10. On-balance volume

On-balance volume, often abbreviated to OBV, is an indicator based on a theory that measures the volume of a market instrument.
The theory is that when price increases, volume increases. The opposite is also true; when an instrument declines in price, the volume decreases.
The golden rule for OBV is: volume precedes price. In other words, the volume will go up or down before prices do.
With the OBV indicator, traders can more clearly see what direction price may go in.
Traders watching the current price may believe that there is a good time to buy, but when they view the OBV, they can see that a trend is not about to emerge and it is only a temporary dip.
Price may continue on the current trend it is already following. In a sense, it is similar to moving averages in how it can spot underlying trends.
Just like many other indicators, OBV cannot be solely relied upon. Ideally, you should use it with another indicator and trust your instincts.
See also: How to Prepare for Forex Trading: 7 Habits that Will Help You
Key points
If you remember anything from this article, make sure it’s these key points.
- Many of the best trend trading strategies rely on patterns emerging.
- Indicators can help you spot trends.
- Some of the most popular trend patterns work both ways.
- Any good strategy should take risk-reward into account.
eToro – Best Social Trading Platform
![]()
![]()
67% of retail investor accounts lose money when trading CFDs with this provider
Learn to use trend following trading strategies with our free forex trading course!
We’ve highlighted 10 of the best trend following trading strategies, but without a proper forex trading education, you’ll struggle to implement them correctly.
That’s where Trading Education comes in.
We’re experts in teaching people how to trade and we believe anyone can learn how to trade.
With our trading course, you will learn:
- Foundation In Forex Trading
- Mechanics Of Forex Trading
- Advanced Analysis in Forex
- Strategy In Forex
Why is our course free?
Our partner brokers are paying for it.
They’re paying for because they know that educated traders are less likely to lose money and quit trading.
How do I get it?
Getting the course is easy, all you have to do sign up to one of our partners, place a deposit, send us your account number and we’ll send you the free course.
It’s your best chance at learning to use trend following trading strategies!