
- The Bitcoin price dropped during the ongoing session, falling short of the $50,000 mark.
- BTC had pushed up by almost 5% on Saturday, as it rose to $49,541.
The Bitcoin price registered a marginal fall during the current session, as sellers ensured that it did not breach $50,000 for the moment. BTC had fallen sharply on Thursday, as the price fell by over 5% and settled at $48,042. The price continued to drop on Friday, as BTC fell to $47,304, but with the 200-day SMA acting as support at this level, recovered and pushed up to $49,451 on Saturday, registering an increase of 4.73%.
Bitcoin Price Chart Indicates BTC Could Drop To $49,000
Thanks to the market crash, the Bitcoin price had dropped considerably over the previous weekend. BTC registered a drop of over 5% going into the weekend on Friday, dropping to $53,752. Saturday saw an even more significant drop, as BTC dropped by 7.57%, slipping below $50,000 and settling at $49,683. BTC remained bearish on Sunday as well, although it registered only a marginal drop of 0.90%. The price pushed up on Monday, as it rose by nearly 2% and settled at $50,142, before pushing up by 0.83% on Tuesday and settling at $50,559.
Image: BTC/USD daily

After Tuesday’s marginal increase, the Bitcoin price saw another marginal increase on Wednesday before registering a drop of over 5% on Thursday and falling to $48,042. BTC continued to drop on Friday, falling by 1.54% and settling at $47,304. However, with the 200-day SMA acting as support at this level, BTC pushed up significantly on Saturday, rising by almost 5% and moving to $49,541 before dropping off during the ongoing session.
We can see that the Parabolic SAR is currently bearish, indicating that we could see the price continue to drop.
Looking at IntoTheBlock’s IOMAP for the Bitcoin price, we can see that BTC has strong support at around $48,382. At this price level, over 1.7 million addresses have bought more than 800,000 BTC. BTC also faces strong resistance at around $55,618. At this price level, over 1.1 million addresses have sold more than 577,000 BTC.
Image: IntoTheBlock

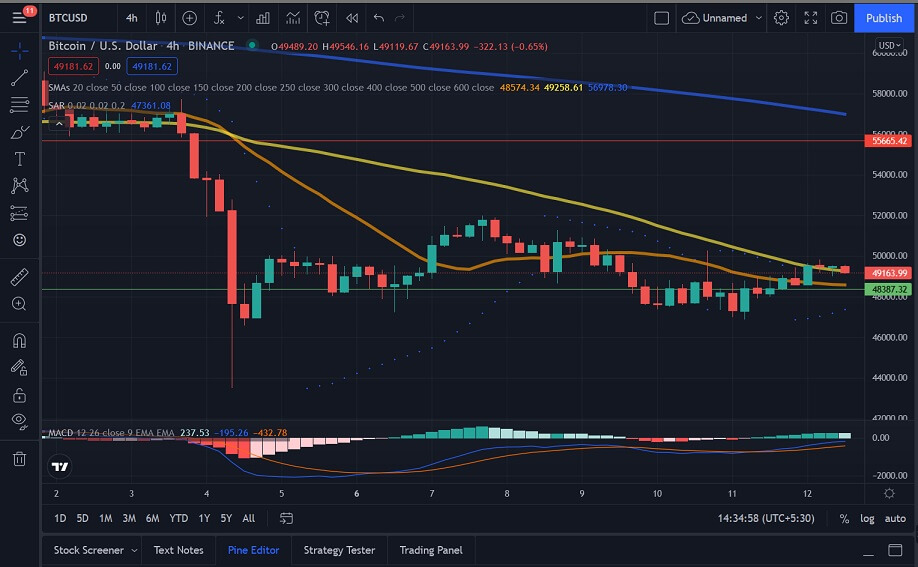
The 4-hour Bitcoin price chart shows us that BTC had pushed above the 20-bar SMA on the 7th when it rose to $50,531. BTC continued to push higher from this level as it moved to $51,783. However, after reaching this level, the price turned bearish and dropped off significantly, slipping below the 20-bar SMA and settling at $49,224. The price pushed up from this level, moving back above the 20-bar SMA but then fell drastically to $47,595 on the 10th. BTC stayed at this level for the subsequent few sessions, registering a marginal drop to $47,298, before pushing back above the 20-bar SMA on the 12th, pushing up to $49,535. Currently, BTC is at $49,181, with sellers looking to move the price to $49,000.
We can see that the MACD and Parabolic SAR are bullish, but if the price continues to drop, we could see them flip back to bearish.
Image: BTC/USD 4-hour
Bitcoins Under ‘HODL’ Metric Hits 11-Month High
Although Bitcoin is experiencing high price volatility, most investors continue to ‘HODL‘ the maiden cryptocurrency, potentially expecting a new future rally. The amount of Bitcoin under HODL recently attained an 11-month high of 7,224,018.804, according to on-chain data provided by Glassnode.
HODLed or lost Bitcoins indicate moves of large and old stashes calculated by substracting Liveliness from 1 and multiplying the result by the circulating supply of the asset. Due to their high volatile nature, Bitcoin and other cryptocurrencies are considered to offer great opportunities for traders to build up long and short positions frequently.
However, HODLing provides more cushion to investors, as they are not exposed to short-term volatility and can avoid the risk of buying high but selling low. The data, therefore, indicate that most investors have potentially continued to accumulate Bitcoin amid the price crash. Usually, when an investment hits an all-time high, that is the least ideal time to buy.
Notably, several crypto analysts have projected that Bitcoin will hit new highs, and investors who missed out on the recent record price are utilizing the current correction to purchase the asset. Furthermore, the Bitcoin under HODL potentially points to the growing status of the number one ranked cryptocurrency as a store of value and a hedge against growing concerns over inflation. In this case, Bitcoin is becoming more valuable, and any price dips make it viable to invest.
Bitcoin Price Is Expected To Reach These Levels
Looking at the Bitcoin price chart, BTC has dropped off during the ongoing session. If the current sentiment persists, we could see BTC slip to $49,000 before recovering.