
- Floki Inu price is poised for a symmetrical triangle breakout on the 4H chart but upside appears bumpy.
- Shiba Inu defends key $0.0000415 support but Monday’s close below 50-DMA signals caution for SHIB bulls.
- Cardano price at a make-or-break position, downside remains favoured while below 200-DMA.
The most widely-traded cryptocurrencies are recovering ground following a dismal start to a fresh week, with Bitcoin recapturing $56,000 while Ethereum is hovering around the $4200 mark.
Although a similar recovery momentum cannot be seen across the altcoins, with Dogecoin’s and Shiba Inu’s battle for supremacy putting them both away from investors’ comfort zone. Their battle has paved the way for lesser-known dog-coins, such as Floki Inu.
The news that Floki Inu has partnered with two professional football clubs Kerala Blasters, India and La Liga Side Cádiz, Spain, also added to memecoin’s growing demand.
Meanwhile, Cardano bulls remain hopeful ahead of its listing on Europe’s largest crypto exchange later this week. Further, new developments and updates are expected to be unveiled on November 25, backing a potential rebound in ADA price.
Among other news, in a 50-second video tweeted for its two million followers, the SHIB team warned, “a fake Shiba telegram group is being shared across social media. They target your hashtags: #shib, #shibarmy, #leash, #shibaswap, #bone.”
“Do not provide email addresses or passwords. Do not join these scam Telegram groups, do not send these scammers any tokens. Do not reply to the bots or fake accounts on social media. Block, report, and stay alert,” the video added.
How are Floki Inu, Shiba Inu and Cardano positioned on the technical charts?
Floki Inu price looks to snap a four-day losing streak
Floki Inu price is trading in the red zone for the fourth straight day, extending the weekend’s weakness into Tuesday.
Despite the downtrend, the dog-themed crypto coin continues to trade within Friday’s massive rebound to near the $0.000235 region.
Over the last hours, FLOKI bears are seen facing exhaustion, with Floki price hovering around $0.000167, posting a 2.80% daily loss.
It seems like FLOKI bulls will fight back control and resume the rebound from three-week lows of $0.000132, well depicted by Floki Inu’s four-hour chart.
The recent downward spiral that followed Friday’s uptrend has carved out a symmetrical triangle formation for FLOKI price on the said time frame.
With the trading range getting tighter each passing hour and a pause in the decline, FLOKI price is poised to break higher from the falling trendline resistance at $0.000174.
A four-hourly candlestick closing above the latter will confirm a triangle breakout, opening doors towards the downward-sloping 100-Simple Moving Average (SMA) at $0.000219.
The upside breakout spotted in the Relative Strength Index (RSI), a leading indicator, points to a potential bullish reversal.
However, it may not be a smooth sail for FLOKI bulls, as a bunch of key moving averages will guard the sellers’ interests on the road to recovery.
Strong resistance is seen around $0.000185-$0.000187, where the 21 and 50-SMAs hang around.
Buyers will then challenge the mildly bullish 200-SMA at $0.000199. A firm break above the latter will target the 100-SMA barrier.
FLOKI/USDT: Four-hour chart

On the contrary, a downside breakout from the rising trendline support at $0.00162 will recall the sellers, exposing Thursday’s low of $0.000132.
Additional declines will then target the $0.00010 demand area.
Read Also: 7 Best Cryptocurrency ETFs To Buy
Shiba Inu remains exposed to downside risks below this key support
Shiba Inu keeps pressuring the downside, in a typical bearish consolidative mode barring an aberration seen last Friday.
In doing so, the canine-themed coin incurs losses for the fourth consecutive day this Tuesday, in what seems like a mixed market sentiment.
Looking at Shiba Inu’s daily chart, sellers remain in charge, given that SHIB price has delivered a daily close below the bullish 50-Daily Moving Average (DMA) at $0.0000445.
The 14-day Relative Strength Index (RSI) continues to point lower while sitting comfortably below the midline, allowing room for more declines.
Therefore, defending $0.0000415 is critical for SHIB bulls. At that level, the 23.6% Fibonacci Retracement (Fibo) level of the rally from October 21 lows of $0.00000270 to the record high lies.
A daily closing below the latter will knock down SHIB price back to $0.0000272, from where the record rally kicked in.
SHIB/USDT: Daily chart
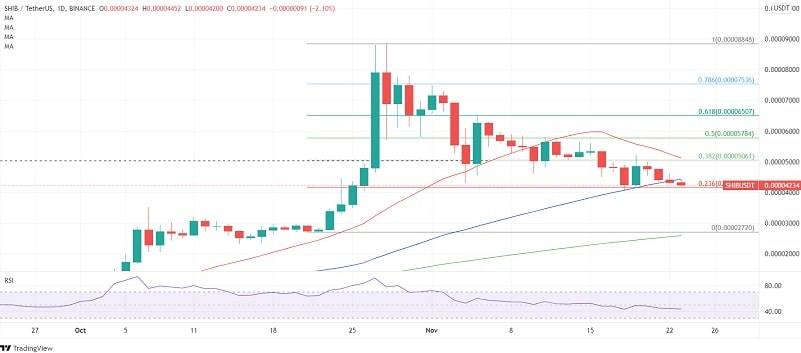
Alternatively, any renewed upside attempts will face initial resistance at $0.0000506, which is the intersection of the 38.2% Fibo level and 21-DMA.
A sustained move above that level will call for a retest of the abovementioned strong hurdle at $0.0000580, which is the 50% Fibo level.
Only a daily closing above that barrier will initiate a fresh advance towards the 61.8% Fibo level of the same ascent at $0.0000650, above which the 78.6% Fibo level at $0.0000753 will get tested.
Check Out: Should You Buy Shiba Inu? 5 Pros, 5 Cons
Cardano price testing the falling wedge support
ADA price is fluctuating between gains and losses so far this Tuesday after opening a fresh week on the wrong footing, as bears refuse to give up yet.
Cardano price is currently trading at $1.77, almost unchanged on the day, lacking a clear directional bias after the recent downbeat momentum.
From a short-term technical perspective, Cardano price has formed a Doji candlestick this Tuesday, suggesting that the sellers are losing conviction to invalidate the upside breakout triggered from a falling wedge formation on November 9.
A rebound from the wedge support at $1.76 could be in the offing, as the RSI attempts recovery from the lower levels. However, with the leading indicator still lying below the midline, any upside attempts could remain limited.
If the recovery momentum sustains above the 200-DMA support-turned-resistance at $1.88, then an advance towards the bearish 21-DMA, now at the $2 mark will be on the table.
The descending 50-DMA at $2.06 will then garner ADA buyers’ attention.
ADA/USD: Daily chart

Alternatively, if the falling wedge support of $1.76 is taken out on a daily closing basis, then ADA sellers will look out for August 11 lows of $1.66.
Further south, the psychological $1.50 level could help limit the downside momentum in ADA price.
Don't Miss: Will Cardano Make Me Rich in 10 Years?