
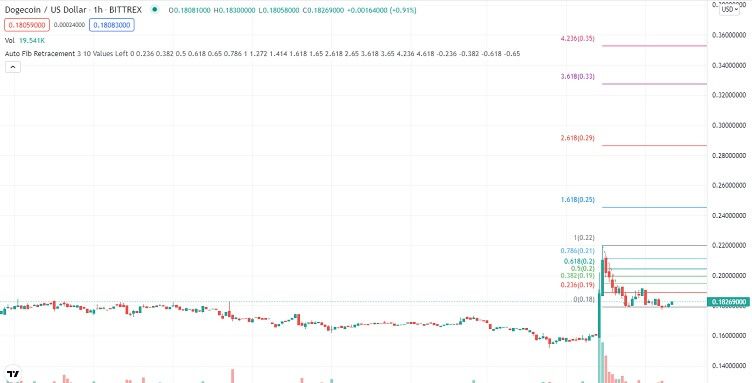
- Dogecoin bounces off the 38.2% Fib support as Tesla news gets priced in.
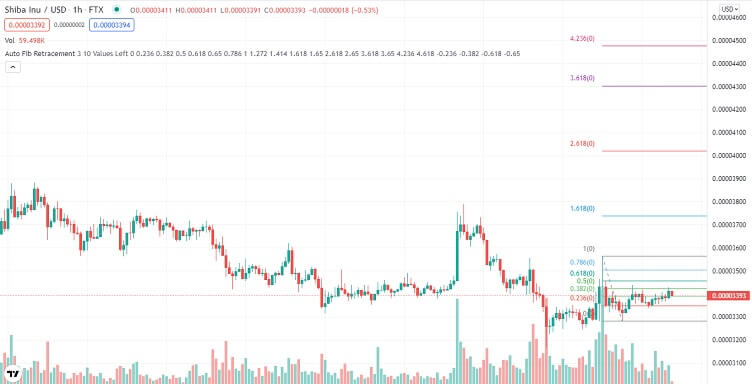
- Shiba Inu breaks the 38.2% Fibonacci resistance as it continues to ride on Dogecoin’s bullish momentum.
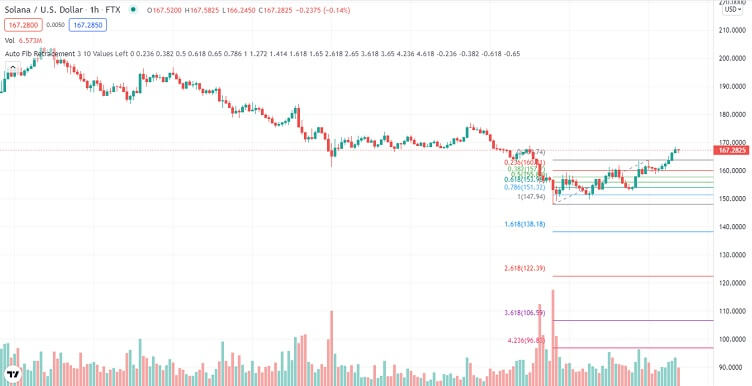
- Solana blasts through two resistance levels as fears about its security subside.
Dogecoin
Dogecoin was bullish for the better part of Tuesday and closed the day higher by 21%.
Dogecoin started Tuesday trading range-bound. This followed a decline in selling momentum after a heavy selloff on Monday.
However, there was a sharp increase in buying volumes at mid-morning, and Dogecoin rallied. Dogecoin had pushed through multiple resistance levels within an hour and came close to testing the 78.6% Fibonacci resistance at $0.2057.
This sharp increase in bullish momentum was triggered by news that Tesla would start selling some of its merchandise in Dogecoin. By early afternoon, Dogecoin was trading at the $0.226 monthly resistance.
However, the impact of Dogecoin’s Tesla news did not last, and bulls lost momentum at the $0.226 monthly resistance.
What followed was a sharp correction that lasted until early evening when bears lost momentum just above the 38.2% Fibonacci support at $0.1778.
Dogecoin bounced off this support, and bulls were in control all through the evening. By the last hour of Tuesday trading, Dogecoin was close to testing the 61.8% Fibonacci resistance at $0.1942.
Dogecoin started Wednesday trading bearish after it failed to test the 61.8% Fibonacci resistance in late Tuesday trading.
Bears were in control all morning, and by mid-morning, Dogecoin was putting pressure on the 38.2% Fibonacci support at $0.1778.
At going to press, Dogecoin had bounced off the 38.2% Fibonacci, albeit with low volumes.
A glance at the day ahead
The key levels to watch are the 50.0% Fibonacci resistance at $0.1860 and the 38.2% Fibonacci support at $0.1778.
If bulls take control and push Dogecoin through the 50.0% Fibonacci resistance at $0.1860, the next key level to watch would be the 61.8% Fibonacci resistance at $0.1940.
If the 50.0% Fibonacci resistance is broken, prices above $0.21 could be seen in the day.
However, if the 38.2% Fibonacci support at $0.1778 is broken, the next level to watch would be the 23.6% Fibonacci support at $0.1675. If this support is broken, prices below $0.160 could be seen in the day.
On the other hand, if volumes drop, Dogecoin could trade between the 50.0% Fibonacci resistance at $0.1860 and the 38.2% Fibonacci support at $0.1778.
A glance at the technicals
Key resistance: 50.0% Fibonacci at $0.1860
Key support: 38.2% Fibonacci at $0.177
Shiba Inu
Shiba Inu was bullish all through Tuesday but with low volumes. By the end of the day, it was up by 2.6%.
Shiba Inu started trading bullish Tuesday, a continuation of a bullish reversal pattern that started in late Monday trading.
However, volumes were low, and bears took control by the third hour of the day. Bearish momentum was quite strong, and by daybreak, Shiba Inu had pushed through the 23.6% Fibonacci support at $0.00003303.
Shiba Inu bears lost control at mid-morning with selling volumes in decline in the broader market.
What followed was a bullish rally through the 23.6% Fibonacci. Bullish momentum was quite strong, and by midday, Shiba Inu had pushed through multiple resistance levels and tested the 61.8% Fibonacci resistance at $0.00003545.
However, bullish volumes dropped at the 61.8% Fib resistance, and a selloff ensued. Bears took control until early evening when Shiba Inu found strong support at $0.00003303 on the 23.6% Fibonacci support.
Buying volumes increased at the 23.6% Fibonacci support, and Shiba Inu was in the green all through the evening. By the last hour of the day, Shiba Inu was trading at the 38.2% Fibonacci resistance at $0.0003396.
Shiba Inu started Wednesday trading bearish after bulls failed to push it through the 38.2% Fibonacci resistance in late Tuesday trading.
However, bearish momentum was weak, and bulls took control by the third hour of the day. A reversal followed by SHIB retest the 38.2% Fibonacci resistance at daybreak.
When going to press, Shiba Inu was still trading at the 38.2% Fibonacci resistance.
A glance at the day ahead
The key levels to watch are the 38.2% Fibonacci resistance at $0.00003396 and the 23.6% Fibonacci support at $0.00003303.
If bulls take control and push Shiba Inu through the 38.2% Fibonacci resistance at $0.00003396, the next key level to watch would be the 50.0% Fibonacci resistance at $0.00003471.
If the 50.0% Fibonacci resistance is broken, prices above $0.00003501 could be seen in the day.
However, if the 23.6% Fibonacci support at $0.00003303 is broken, the next level to watch would be the multi-month support at $0.00003154. If this support is broken, prices below $0.000003000 could be seen in the day.
On the other hand, if volumes drop, Shiba Inu could trade between the 38.2% Fibonacci resistance at $0.00003396 and the 23.6% Fibonacci support at $0.00003303.
A glance at the technicals
Key resistance: 38.2% Fibonacci at $0.00003396
Key support: 23.6% Fibonacci at $0.00003303
Solana
Solana had a mixed day on Tuesday but still closed the day higher by 6.8%.
Solana started Tuesday trading bearish after bulls failed to push it through the 23.6% Fibonacci resistance at $156.26 in late Monday trading.
However, bears lost momentum at daybreak, slightly above the multi-month support at $147.92.
This saw bulls take control, and with high volumes. Bullish momentum was quite strong, and by midday, Solana had pushed through the 23.6% Fibonacci, and with high volumes.
However, in the late afternoon, Solana bulls hit strong resistance at $161.51 on the 38.2% Fibonacci resistance.
What followed was a correction that lasted until early evening. That’s when Solana found support at $153.54, now a major support level in the day.
Solana bounced off this support, and bulls were in control for the rest of the evening. Solana was trading at $161.51 on the 38.2% Fibonacci resistance by the end of the day.
Solana started Wednesday trading bearish, after bulls lost momentum at the 38.2% Fibonacci resistance. However, momentum was weak, and bulls were back in control by daybreak.
At the time of going to press, Solana had pushed through the 38.2% Fibonacci resistance, the 50.0% Fibonacci resistance at $165.72, and upside momentum was on the rise.
A glance at the day ahead
The key levels to watch are the 50.0% Fibonacci support at $165.74 and the 61.8% Fibonacci resistance at $169.82.
If bulls take control and push Solana through the 61.8% Fibonacci resistance at $169.82, the next key level to watch would be the 71.8% Fibonacci resistance at $175.94.
If the 71.8% Fibonacci resistance is broken, prices above $180 could be seen in the day.
However, if the 50.0% Fibonacci support at $165.74 is broken; the next level to watch would be the 38.4% Fibonacci support at $161.45. If this support is broken, prices below $155 could be seen in the day.
On the other hand, if volumes drop, Solana could trade between the 61.8% Fibonacci resistance at $169.92 and the 50.0% Fibonacci support at $165.74.
A glance at the technicals
Key resistance: 61.8% Fibonacci at $169.92
Key support: 50.0% Fibonacci at $165.74