
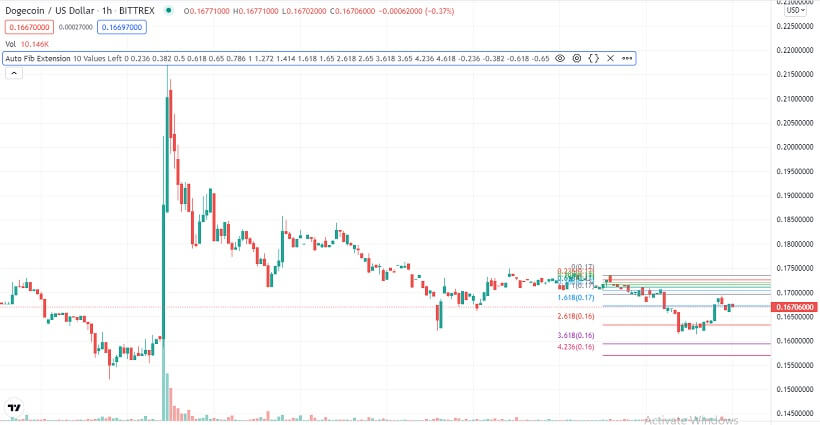
- Dogecoin pushes through 38.2% Fibonacci resistance at $0.1669, but volumes are still too low.
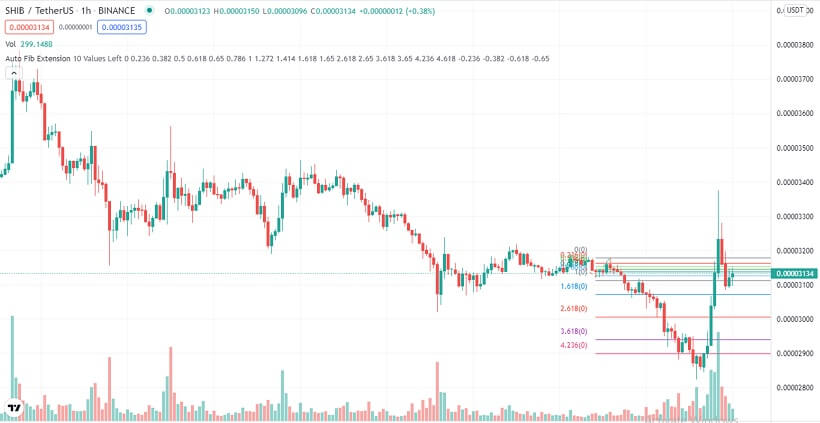
- Shiba Inu is trending towards 23.6% Fibonacci support at $0.00003035 in possible continuation of the multi-week bear run.
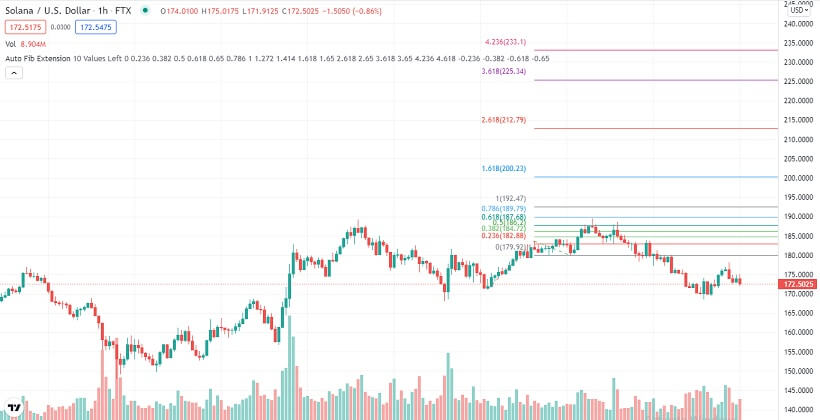
- Solana bulls are gaining momentum as it bounces off 38.2% Fibonacci support at $173.35
Dogecoin
On Monday, Dogecoin had a mixed day and closed the day lower by 2.19%.
Dogecoin started Monday trading range-bound between the 61.8% Fibonacci resistance at $0.176 and the 50.0% Fibonacci support at $0.1688.
It traded at this range for a few hours, but just before daybreak, bears took control. This saw Dogecoin drop quite hard and test the 38.2% Fibonacci support at $0.1669.
The selloff accelerated at daybreak, and by mid-morning, Dogecoin was trading at $0.1609, a key weekly support level.
The weekly support proved to be quite strong, and Dogecoin bounced off it, albeit with low volumes.
Without much volume, Dogecoin traded in a range between the weekly support at $0.1669 and the 23.6% Fibonacci at $0.1646, which was resistance at the time.
However, there was an upsurge in buying volumes in the early evening, and Dogecoin rallied through the 23.6% Fibonacci resistance. It kept edging higher, and by the end of the day, was trading at the 50.0% Fibonacci, now resistance at $0.1688.
Dogecoin started Tuesday trading bearish after bulls lacked the momentum to push it through the 50.0% Fib resistance. When going to press, Dogecoin bears were putting pressure on the 38.2% Fibonacci support at $0.1669.
A glance at the day ahead
The key levels to watch are the 38.2% Fibonacci, now resistance at $0.1669, and the 23.6% Fibonacci support at $0.1646.
If bulls take control and push Dogecoin through the 38.2% Fibonacci resistance at 0.1669, the next key level to watch would be the 50.0% Fibonacci resistance at $0.1688.
If the 50.0% Fibonacci resistance breaks, prices above $0.175 could be seen within the day.
However, if the 23.6% Fibonacci support at $0.1646 is broken; the next level to watch would be the weekly support at $0.1609. If the weekly support is broken, prices below $0.15 could be tested within the day.
On the other hand, if volumes drop, Dogecoin could trade between the 23.6% Fibonacci support at $0.1646 and the 38.2% Fibonacci resistance at $0.1669.
A glance at the technicals
Key resistance: 38.2% Fibonacci at $0.1669
Key support: 23.6% Fibonacci at $0.1646
Shiba Inu
Shiba Inu had a highly volatile start to the week, and closed the day pretty much where it had started.
Shiba Inu started Monday trading bearish. This was a continuation of the bearish trend that characterized SHIB trading all through the weekend.
The selloff was quite strong until mid-afternoon when Shiba Inu hit multi-month support at $0.00002824.
Shiba Inu bounced off the multi-month support with high volumes, triggering a V-shaped recovery.
By the end of the day, Shiba Inu had pushed through multiple resistance levels to test the 78.6% Fibonacci resistance at $0.00003529.
However, this resistance proved to be quite strong for bulls, and there was a sharp rejection. This saw Shiba Inu close Monday trading slightly below the 61.8% Fibonacci resistance at $0.00003378.
Shiba Inu started Tuesday trading in the red after the strong bull rejection at the 78.6% Fibonacci resistance. When going to press, SHIB was close to testing the 23.6% Fibonacci support at $0.00003035.
A glance at the day ahead
The key levels to watch are the 23.6% Fibonacci support at $0.00003035 and the 38.2% Fibonacci resistance at $0.00003199.
If bulls take control and push Shiba Inu through the 38.2% Fibonacci resistance at $0.00003199, the next key level to watch would be the 50.0% Fibonacci resistance at $0.00003304. If the 50.0% Fibonacci resistance is broken, prices above $0.00003499 could be possible in the day.
However, if the 23.6% Fibonacci support at $0.00003035 breaks, Shiba Inu could trade in the red all day. If this happens, prices below $0.0000290 could be seen in the day.
On the other hand, if volumes drop, Shiba Inu could trade between the 38.2% Fibonacci resistance at $0.00003199 and the 23.6% Fibonacci support at $0.00003035.
A glance at the technicals
Key resistance: 38.2% Fibonacci at $0.00003199
Key support: 23.6% Fibonacci at $0.00003035
Solana
Solana had a relatively bearish start to the week. By the end of the day, it was down by 4.29%.
Solana started Monday trading in the green. This was after bulls managed to hold it above $179.43, on the 23.6% Fibonacci, then support for the last few hours of Sunday trading. That was despite a heavy selloff for most of the weekend.
However, with the broader market overall bearish, the 23.6% Fibonacci support gave way by the second hour of the day.
What followed was range-bound just below the 23.6% Fibonacci support level until daybreak. It is at daybreak that Solana bulls lost, and Sunday’s selloff continued.
The selloff was quite strong, and by early afternoon, Solana was trading at the 50.0% Fibonacci support at $168.47.
However, by this time, Solana was getting into oversold territory. What followed was a bounce off the 50.0% Fibonacci support.
Bulls took control for the rest of the day until about 2-hours to the end of the day. That’s when bulls started to show weakness just below the 23.6% Fibonacci, now resistance at $179.43.
This saw Solana end the day in the red. Solana had retraced back to the 38.2% Fibonacci by the last hour of the day, now support at $173.35.
Solana started trading bullish Tuesday after bears failed to push it through the 38.2% Fibonacci support. When writing, Solana was still in the green and was close to retesting the 23.6% Fibonacci resistance at $179.43.
A glance at the day ahead
The key levels to watch are the 23.6% Fibonacci resistance at $179.43 and the 38.2% Fibonacci support at $173.35.
If bulls take control and push Solana through the 23.6% Fibonacci resistance, the next key level to watch would be the weekly high of $189.44.
If the weekly high of $189.44 broken, Solana could test prices above $200 in the day.
However, if the 38.2% Fibonacci support at $175.35 is broken, the next key level to watch would be 50.0%
Fibonacci support at $168.47. If this support is broken, prices below $165 could be hit within the day.
On the other hand, if volumes drop, Solana could trade between the 23.6% Fibonacci resistance at $179.43 and the 38.2% Fibonacci support at $173.35.
A glance at the technicals
Key resistance: 23.6% Fibonacci at $179.43
Key support: 38.2% Fibonacci at $173.35