
- Dogecoin makes a strong reversal off the 61.8% Fibonacci support at $0.1740. It needs to push through the 50.0% Fib resistance at $0.1781 for an uptrend to be confirmed.
- Shiba Inu bulls struggle at $0.00003545 on the 38.2% Fibonacci resistance.
- Solana bears are still in control as they target 78.6% Fibonacci support at $175.79
Dogecoin
Dogecoin was bearish for the better part of Tuesday. By the end of the day, it was down by 12%.
Dogecoin started Tuesday trading bearishly, and within the first hour of the day, had crossed through the 23.6% Fibonacci support at $0.1874.
The selloff was quite strong, and just before daybreak, DOGE had broken the 38.2% Fibonacci support at $0.1823 and tested the 50.0% Fibonacci support at $0.1781.
The 50.0% Fibonacci support proved to be quite strong, and Dogecoin bounced off it. By noon, Dogecoin had retested the 38.2% Fibonacci, then resistance at $0.1823.
The 38.2% Fibonacci resistance proved to be quite strong, and with the broader market bearish, the 50.0% Fibonacci support at $0.1781 gave way.
By early evening, Dogecoin had hit the 61.8% Fibonacci support at $0.1740. Dogecoin bounced off this support, and by the end of the day, had retested the 50.0% Fibonacci, now resistance at $0.1781.
Dogecoin started Wednesday trading bearish after bulls failed to push through the 50.0% Fibonacci resistance at $0.1781.
When going to press, Dogecoin was trading at $0.1740 at the 61.8% Fibonacci support.
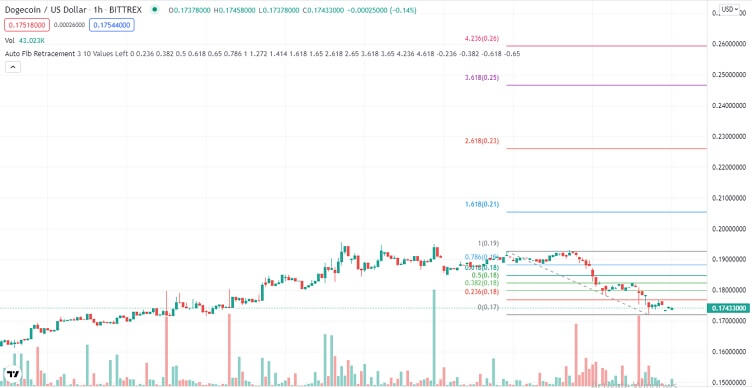
Source: TradingView
A glance at the day ahead
The key levels to watch are the 50.0% Fibonacci resistance at $0.1781 and the 61.8% Fibonacci support at $0.1740.
If bulls take control and push Dogecoin through the 50.0% Fibonacci resistance at $0.1781, the 38.2% Fibonacci resistance at $0.1823 would come into focus. If the 38.2% Fib resistance breaks, prices above $0.1857 could be seen in the day.
However, if bears take control and push Dogecoin through the 61.8% Fibonacci support, the next key level to watch would be the 78.6% Fibonacci support at $0.1682.
If Dogecoin pushes through the 78.6% Fibonacci support, prices below $0.164 could be attainable within the day.
On the other hand, if volumes drop, Dogecoin could trade between the 50.0% Fibonacci resistance at $0.1781, and the 61.8% Fibonacci support at $0.1740.
A glance at the technicals
Key resistance: 50.0% Fibonacci at $0.1781
Key support: 61.8% Fibonacci at $0.1740
Shiba Inu
Shiba Inu was bearish for the better part of Tuesday. By the end of the day, SHIB was down by 12.5%.
Shiba Inu started Tuesday trading bearish, a continuation of the selloff that started in late Monday trading.
By the second hour of the day, Shiba Inu had pushed through the 23.6% Fibonacci support at $0.00003716.
Just before daybreak, Shiba Inu came close to testing the 38.2% Fibonacci support at $0.00003545.
However, the 38.2% Fibonacci support proved to be too strong for bears, and Shiba Inu bounced off it.
By mid-morning, Shiba Inu had tested the 23.6% Fibonacci, now resistance, at $0.00003716.
However, with the broader market bearish, Shiba Inu bulls could not break the 23.6% Fibonacci support. What followed was a crash that saw Shiba Inu breach the 38.2% Fibonacci support, and test the 50.0% Fibonacci support at 0.00003410.
SHIB bounced off the 50.0% Fibonacci support, and by the end of the day, had retested the 38.2% Fibonacci, now resistance at $0.00003545.
Shiba Inu started Wednesday trading at the 38.2% Fibonacci resistance. However, volumes were low, and at the time of going to press, SHIB was yet to push through this resistance.
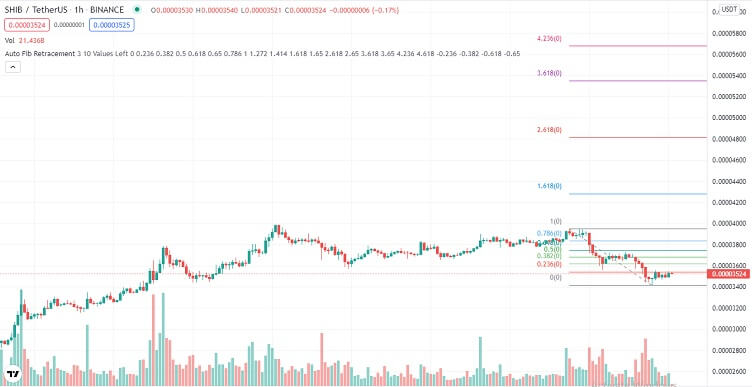
Source: TradingView
A glance at the day ahead
The key levels to watch are the 38.2% Fibonacci resistance at $0.00003545 and the 50.0% Fibonacci support at $0.00003408.
If bulls take control and push Shiba Inu through the 38.2% Fibonacci resistance at $0.00003545, the 23.6% Fibonacci resistance at $0.00003716 would come into focus. If the 23.6% Fibonacci resistance at $0.00003716 is broken, prices above $0.00003901 could be seen in the day.
However, if the 50.0% Fibonacci support at $0.00003408 is broken, prices below $0.00003321 could be seen within the day.
On the other hand, if volumes drop, Shiba Inu could trade between the 38.2% Fibonacci resistance at $0.00003545, and the 50.0% Fibonacci support at $0.00003408.
A glance at the technicals
Key resistance: 38.2% Fibonacci at $0.00003545
Key support: 50.0% Fibonacci at $0.00003408
Solana
Solana was bearish for the better part of Tuesday, and by the end of the day, was down by 10.27%.
Solana started Tuesday trading bearish, a continuation of the selloff that started in late Monday trading.
Within three hours of trading, Solana had breached the 38.2% Fibonacci support at $190.73 and tested the 50.0% Fibonacci support at $186.31.
After such heavy selling, Solana bulls attempted to take control at $186.31 on the 50.0% Fibonacci support.
By mid-morning, Solana bulls had hit and briefly pushed through the 38.2% Fibonacci resistance at $190.73.
However, with the broader market overall bearish, bulls could not sustain momentum through the 38.2% Fibonacci resistance at $190.73.
The selloff accelerated, and by early evening, Solana had tested the 78.6% Fibonacci support at $175.79.
It bounced off this support, and within an hour, had tested the 61.8% Fibonacci resistance at $181.96.
Bulls lost momentum again, weighed down by selling pressure in the broader market. By the end of the day, Solana was close to retesting the 78.6% Fibonacci support at $175.79.
Solana started Wednesday trading bullish after bears lost momentum slightly above the 78.6% Fibonacci support. At the time of going to press, bulls were still in control, but volumes were low.
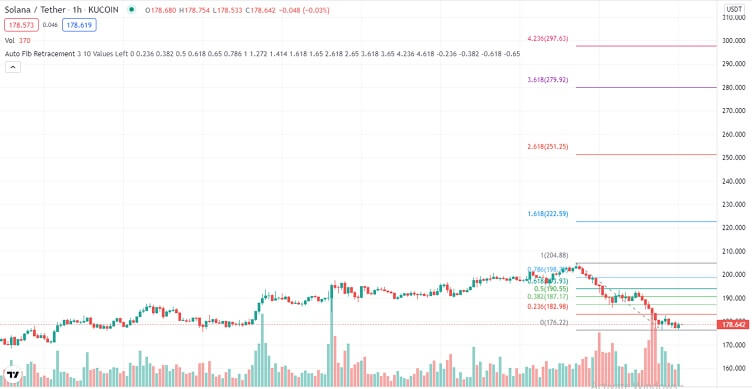
Source: TradingView
A glance at the day ahead
The key levels to watch are the 61.8% Fibonacci resistance at $181.96 and the 78.6% Fibonacci support at $175.79.
If bulls take control and push Solana through the 61.8% Fibonacci resistance, the next key level to watch would be the 50.0% Fibonacci resistance at $186.31. If the 50.0% Fibonacci resistance is broken, prices above $190 could be seen within the day.
However, if the 78.6% Fibonacci support at $175.79 is broken, the next key level to watch would be the multi-week support at $167.86. If this support is broken, prices below $165 could be seen in the day.
On the other hand, if volumes drop, Solana could trade between the 61.8% Fibonacci resistance at $181.96 and the 78.6% Fibonacci support at $175.79.
A glance at the technicals
Key resistance: 61.8% Fibonacci at $186.96
Key support: 78.6% Fibonacci at $175.79