
- Dogecoin bounces off key support but needs to push through the 50.0% Fibonacci resistance at $0.1758 for an uptrend to be confirmed.
- Shiba Inu oscillating between the 50.0% Fibonacci resistance at $0.00002912 and the 61.8% Fibonacci support at $0.00002825. Needs to breakout for a trend to be confirmed in any direction.
- Solana bulls are testing the 61.8% Fibonacci resistance at $140.43, but need to break through it to confirm the bull trend.
Dogecoin
Dogecoin was range-bound for the better part of Monday. By the end of the day, it was down by about 1%.
Dogecoin started Monday trading bearish after it pushed through the 50.0% Fibonacci support at $0.1758 within the first hour of the day.
However, just before daybreak, selling volumes dropped. What followed was range-bound trading until early afternoon.
It is at this point that bears attempted to retake control. However, bearish momentum did not last as two hours later, Dogecoin hit strong support at $0.16689 on the 61.8% Fibonacci support.
Dogecoin then bounced off this support, and towards the end of the day, came close to retesting the 50.0% Fibonacci, now resistance at $0.1758.
The move was sharply rejected, though, and Dogecoin retested the 61.8% Fibonacci support at $0.1668 just three hours to the end of the day. Dogecoin then bounced off this support and closed the day in the green.
Dogecoin started Tuesday trading bullish, a continuation of the upside momentum that had built up in late Monday trading.
However, just two hours into the day, bulls lost momentum. What followed was a correction that saw Dogecoin retest the 61.8% Fibonacci support just before daybreak.
The 6.1% Fibonacci support proved quite strong, though, and Dogecoin was gaining upside momentum when going to press.
.jpg)
Source: TradingView
A glance at the day ahead
The key levels to watch are the 50.0% Fibonacci resistance at $0.1758 and the 61.8% Fibonacci support at $0.1668.
If bulls take control and push Dogecoin through the 50.0% Fibonacci resistance at $0.1758, the next key level to watch would be the 38.2% Fibonacci resistance at $0.1851. If the 38.2% Fib resistance is broken; prices above $0.195 could be tested within the day.
However, if bears take control and push Dogecoin through the 61.8% Fibonacci support at $0.1668, prices below $0.1589 could be tested in the day.
On the other hand, if volumes drop, Dogecoin could trade between the 50.0% Fibonacci resistance at $0.1758 and the 61.8% Fibonacci support at $0.1668.
A glance at the technicals
Key resistance: 50.0% Fibonacci at $0.1758
Key support: 61.8% Fibonacci at $0.1668
Shiba Inu
Shiba Inu was bearish for the better part of Monday. By the end of the day, it was down by 3.2%.
Shiba Inu started Monday trading bearish, and within the first three hours of the day, had pushed through the 38.2% Fibonacci support at $0.00003001.
Bearish momentum accelerated, and just before daybreak, SHIB hit the 50.0% Fibonacci support at $0.00002912.
This support proved to be too strong for bears, but buying volumes were not that strong either. What followed was range-bound trading above the 50.0% Fibonacci support at $0.00002912 until early afternoon.
At this point, selling volumes increased, and Shiba Inu bears pushed SHIB through the 50.0% Fibonacci support.
Selling volumes until late afternoon, when Shiba Inu came close to testing the 61.8% Fibonacci support at $0.00002825.
However, the move was rejected, and bulls attempted to retake control in the early evening. They didn’t have many volumes though, and couldn’t push Shiba Inu through the 50.0% Fibonacci, now resistance at $0.000002912.
A correction followed, and just two hours to the end of the day, SHIB tested the 61.8% Fibonacci support at $0.00002825.
The move was rejected, though, and SHIB ended the day in the green, though it didn’t retest the 50.0% Fibonacci resistance at $0.00002912.
Shiba Inu started trading bullish Tuesday, continuing the bullish momentum that was building up in late Monday trading.
However, just two hours into the day, bulls encountered strong resistance at $0.00002912 on the 50.0% Fibonacci resistance.
What followed was a correction until daybreak, when bears lost momentum. When going to press, SHIB bears had retaken control.
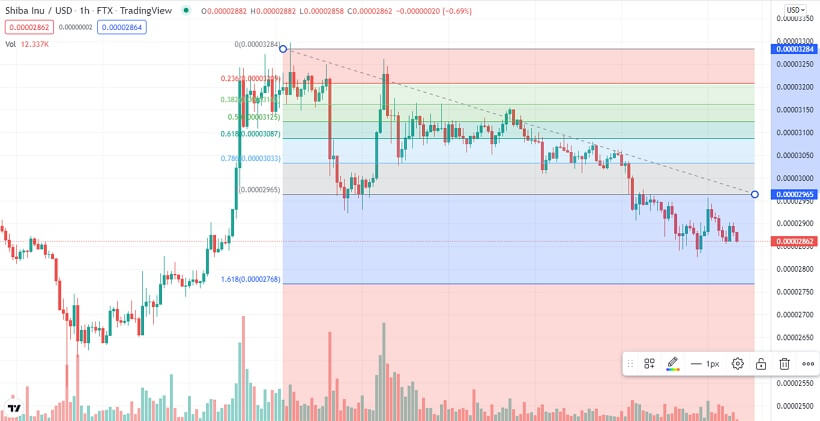
Source: TradingView
A glance at the day ahead
The key levels to watch today are the 50.0% Fibonacci resistance at $0.00002912 and the 61.8% Fibonacci support at $0.00002825.
If bulls take control and push Shiba Inu through the 50.0% Fibonacci resistance at $0.00002912, the 38.2% Fibonacci resistance at $0.00003001 would come into focus. If the 38.2% Fibonacci resistance is broken, prices above $0.00003079 could be tested within the day.
However, if the 61.8% Fibonacci support at $0.00002825 is broken, prices below $0.00002762 could be hit within the day.
On the other hand, if volumes drop, Shiba Inu could trade between the 50.0% Fibonacci resistance at $0.00002912 and the 61.8% Fibonacci support at $0.00002825.
A glance at the technicals
Key resistance: 50.0% Fibonacci at $0.00002912
Key support: 61.8% Fibonacci at $0.00002825
Solana
Solana was bearish for the better part of Monday. By the end of the day, it was down by 3.4%.
Solana started Monday trading bearish, after it pushed through the 38.2% Fibonacci support at $147.13.
Bears retained control, and just before daybreak, Solana pushed through the 50.0% Fibonacci support at $143.73.
Selling momentum dropped shortly after, though, and Solana consolidated just below the 50.0% Fib support until late afternoon.
It is at this point that bearish volumes shot up again. Solana pushed through the 61.8% Fibonacci support at $140.43, and two hours to the end of the day was close to testing the 78.6% Fibonacci support at $135.76.
However, a bullish wave swept through, and Solana closed the day at the 61.8% Fibonacci, now resistance at $140.43.
Solana started Tuesday trading bullish, and within an hour into the day, Solana had pushed through the 61.8% Fibonacci resistance at $140.43.
This momentum did not last though. When going to press, Solana was oscillating below the 61.8% Fibonacci resistance at $140.43.
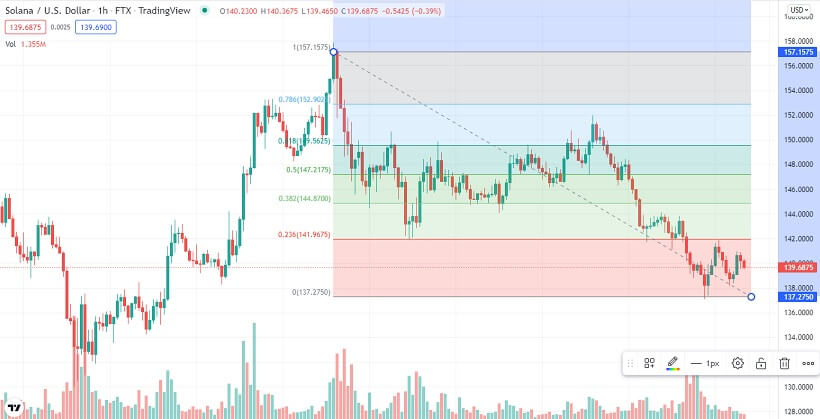
Source: TradingView
A glance at the day ahead
The key levels to watch are the 61.8% Fibonacci resistance at $140.43 and the 78.6% Fibonacci support at $135.76.
If bulls take control and push Solana through the 61.8% Fibonacci resistance at $140.43, the 50.0% Fibonacci resistance at $143.78 would come into play. If it’s broken, prices above $157 could be tested in the day.
However, if the 78.6% Fibonacci support at $135.76 is broken, the 61.8% Fibonacci support at $110.73 would come into play. If the 61.8% Fib support is broken, prices below $133 could be tested in the day.
On the other hand, if volumes drop, Solana could trade between the 61.8% Fibonacci resistance at $140.43 and the 78.6% Fibonacci support at $135.76.
A glance at the technicals
Key resistance: 61.8% Fibonacci at $140.43
Key support: 78.6% Fibonacci at $135.76